Gold Expected to Rise 7% | Is This the Best Time to Buy Bitcoin? – Feb 6, 2026
Hello, good day to you. Let’s have today’s gold analysis. Today is February 6th, 2026. I’ll talk about gold and then we’ll briefly touch on crypto as well. Well, our expectation for the gold market yesterday in these areas ($4,810) was that from the 38% Fibonacci level—that is the Fibonacci we drew here from the bottom at $4,401—we expected the Fibonacci here to act as support and for the price to bounce back up ($4,831).
Yesterday, the market was very rangebound and really frustrating, both in the London market and the New York market. In the end, after a lot of movement, it came down to the 61% Fibonacci level and gave us a correction ($4,656), but the market bounced back up. As you know, I tell the guys every day to review the previous day’s analysis and mark each video as either correct or invalid, which thank God so far, our rate of correct analysis has been higher.
Targets and Invalidation
Look here, we still can’t say about yesterday’s analysis whether it turned out to be correct or not because we talked about targets at $5,400. So for now, I’ll label yesterday’s analysis as “not to change” until we see whether we finally reach $5,400 or not.
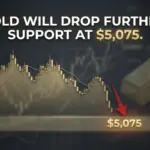
If from these areas, meaning $4,500, we move downward and break this bottom ($4,401), we can say all our analyses over the past few days were wrong, but I still think the probability of this is less than 10%. We are still aiming for the $5,400 target. If we look at this move ($5,086 to $4,792), and we break the upward side of $5,100, we will move towards $5,400, which is exactly our target.
Trading vs. Analysis
Trading is completely different from analysis. You watch my analyses, but based on your own timing on the chart, you do your own analysis and open your trades. Yesterday, I saw the market was getting really tricky, so I took a little profit. The profit that was over $1,000 dropped to $400 or $500, and I closed it around here ($4,859) because the market had become exhausting.
Today again, from this upper area ($4,879), I took my sell position. The reason is that it was between the 55% to 60% Fibonacci levels, and I expect a correction at least down to these areas ($4,818) or even these zones ($4,739).
Today’s Scenarios
What is my expectation for the market today? I still expect that the market can correct down to these zones ($4,747) and even lower down to the $4,550 area. But the scenario I think is more reasonable is that we’ve already had our correction down to the 61% Fibonacci level ($4,665) and bounced back strongly.
Now, my expectation in this area ($4,856) is that the market should correct down to these areas ($4,820), which was our low from yesterday, and from there move upward toward the $5,400 target. The second scenario is that if this wave becomes even more frustrating, it could come down to the $4,700 area again. The third scenario is that the market moves down to $4,550 and gets support there, but I don’t really expect this as it would scare traders away from the market.
Crypto and Bitcoin Analysis
Regarding crypto, a lot of people are scared, but I still don’t trade Bitcoin or altcoins with leverage; I only make spot purchases. I made a purchase myself right in these areas, a bit higher around $70,000.
If you set Bitcoin’s chart to logarithmic, nothing special has happened. We broke through the 2021 peak zones ($66,797) to the upside and are now doing a pullback to move higher. Everyone expected Bitcoin to reach the $60,000 to $65,000 range in the fall of 2026, but we reached it very quickly. If it’s supposed to drop from here ($60,000), Bitcoin won’t make it out alive, but we reached the target we were supposed to wait 6 months for. So now is the best time to buy Bitcoin. Don’t forget this. Stay happy and successful.