Daily Gold Analysis, February 12, 2026 (Thursday)
Hello, good day to you. Today is February 12, 2026, and let’s have a daily analysis of gold.
Analysis of the Recent Status of the Crypto Market and Bitcoin
Regarding crypto and Bitcoin, yesterday we could have taken the profit we wanted from the exact area I explained to you, on the Fibonacci 50% level. It could have given us a very good profit; approximately from the Fibonacci 50% areas (66136), we could have had a profit of about 3% without leverage on Bitcoin, which naturally, for example with a leverage of 2, you could have taken a 6% profit from the market yesterday.
Shifting Focus from Crypto to the Gold Market
But the crypto market is no longer analyzable for us for now; at least with the methods we know. Now, if friends know how to analyze it, well, naturally it is better that they perform the analysis with their own method. But for now, we are returning to gold. Gold is still in that range it was in, but with a fundamental difference: yesterday it broke this range; meaning it broke this area upwards. Exactly yesterday, it broke this area (5082) to the upside. It broke the areas to the upside and had a return.
Predicting Gold’s Rise Based on Fibonacci Levels
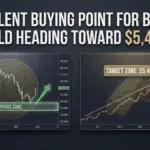
Well, we know that here (4654), in this movement, we had a drop to the Fibonacci 61% area (4664); so the expectation we can have is that from right here, exactly where we are now (5085), gold will have a rise and can give us a profit of about that same 5400, or even more. But how? Well, it’s better for us to look at the broker’s chart and the 4-hour timeframe, not the MetaTrader chart. The broker’s chart is much more accurate; we see that here on the 4-hour, it has closed a candle exactly (5064) and wants to give us a pullback.
Reviewing Open Trade Details and Risk Management
The expectation I have for gold—let me bring up the broker’s chart for you—the expectation I have for gold is that it gives us this move. Well, let me share this screen with you. As you can see, here in this trade that I have on the broker, I entered from this area (5055). What is the reason? And I set my stop point exactly at the entry point of this very trade. And now I will bring the stop a bit lower; for example, I’ll bring the stop to these areas (5042), because the profit this trade is going to give me is very high, something around 20,000 dollars.
Analyzing Lower Timeframes and Determining Price Targets
But the move that—let me keep my stop at the entry point for now (5055)—and the move we expect from gold; see, it’s that a very, very good 4-hour has closed—it’s not possible to zoom in more than this—a very, very good 4-hour has closed exactly on these areas (5062). And we expect a rise from this area for it. On the other hand, if we go to the 15-minute, for example, we see that gold had an upward move here. It had an upward move here (from 5000 to 5120) and came to give us exactly the 50 to 61 Fibonacci (from 5060 to 5046) and from 50% (5060) it can, in fact, have a price increase.
Final Summary and the 5400 Target
Even if we take this wave (from 5018 to 5100), again this wave—let me delete this—even if we take this wave which is from here to here, again on the Fibonacci 50% areas (5061) we can see gold being supported from this 50% area, and it will give us a price increase. My own target for gold for the next few days, maybe even today or tomorrow, is 5400.
Be happy and successful.