Three Key Gold Price Increase Scenarios – February 14, 2026
Current Analysis and Review of Yesterday’s Performance
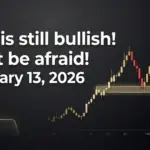
Hello, let’s have the daily gold analysis for today, February 14th, 2026. It is Saturday, and the market is currently closed until Monday, but we can certainly take this time to perform our detailed technical analysis in preparation for the market’s next opening on Monday morning. Yesterday, exactly as we had previously analyzed together, the price of gold moved significantly upward occurring right after we finished recording the video. During yesterday’s session, I specifically mentioned that gold was trading within these particular zones ($4,970) and I clearly stated that it could make a strong move from there towards the areas below this range that had been used as support ($4,945). From here ($4,942), it could make a bullish move and that’s exactly what happened. If we draw the Fibonacci as well, we can see that right here it’s exactly at the 50% level the Fibonacci level ($4,942) the price moved upwards. But the price moved upwards, now we have to see what the market has in store for us on Monday.
Identification of Key Levels and Fibonacci Reaction Zones
If we want to consider this area ($5,041) as an important level, what we are seeing here is exactly a breakout and it is a very clear and distinct breakout on the chart. And if we want to draw a Fibonacci retracement starting from the very beginning of this specific move meaning from right here downwards (from $5,118 to $4,878), we can see the levels clearly. We can see that the price is reacting exactly between the 61% and 78% Fibonacci levels. The 61% and 78% Fibonacci is exactly here, meaning a bit higher than what we see, the range of $5,047. This is the area where a decision could be made as soon as the Sydney market opens on Monday.
Potential Scenarios for Monday’s Market Opening
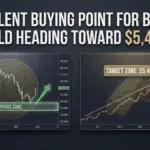
With the opening of the gold market, we can observe the market’s reaction here. There are two possible scenarios or reactions. One is that it breaks through this zone ($5,047). If it breaks through this exact $5,047 zone, we can then say that gold has turned bullish towards our target which is $5,400. If not, if it wants to turn down from this zone ($5,047) and move downward, what could happen? If it moves downward, it could come down to this exact zone to take out the logical liquidity at $4,907 and then move upward. That possibility exists.
Probability Assessment and Path to the $5,400 Target
So we have two scenarios for it which we’ll discuss together in the video on Monday morning, since we won’t have a video tomorrow. One scenario is that it moves up a bit and then heads downward from here ($4,907), which I’d say there’s maybe a 30% chance for this (Scenario 1). And the second scenario is that right from here ($5,047) with the market opening, maybe even with a heavy gap, we move upward. We might find some support in these areas here ($5,119), find support at $5,071 and then move upward. Of course, that doesn’t mean it will happen easily. It’s not like we’ll go straight up to $5,400 here. Again, we’ll see some fluctuations in the market (the $5,024 area) but ultimately we’ll reach our target which is $5,400. The market is currently doing exactly that, behaving just as we had anticipated. I’d say there’s a 20-30% chance of this happening (Scenario 1) and an 80% chance of this move (Scenario 2).
Cryptocurrency Market Review (Bitcoin and Ethereum)
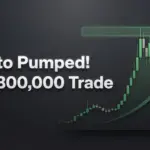
As for crypto, the market has really reached a point now. It’s the weekend, but my expectation for crypto is bullish because it already hit the 50% level ($66,136) and after that we can conclude that crypto has decided to move upward. Although we might see some fluctuations or corrections downward before moving up, but for now in my opinion it’s not tradable. It’s not in a good zone. For example, if we were here ($66,136) I would say okay you could go long on the market. If we were here ($65,294) I would say go long on the market. But right now ($68,811) this really isn’t a place that’s tradable. We should wait for a correction ($67,558) and then it can start moving upward. At the very least, it might give another correction down to around the 50% level again ($66,136) if it wants to pull back to this trend line or even go towards lower levels and then make a decision.
Advice for Traders and Recent Gold Performance
For now, I don’t see any particular position on either Ethereum or Bitcoin that I could recommend. Since it’s Saturday and Sunday, I think it’s much better to stay away from the market for now. We’re doing our analysis and trading on gold to see what happens. Gold is giving us some good opportunities. I personally made some good profits from the market right here ($5,040). I had a long position from exactly this point ($4,942) until last night, and right before the market finally closed, I decided to close out my entire position. It was a truly exceptional and strategic point to enter. Yesterday was a remarkably favorable opportunity for trading for those of you who watched the video. Stay successful and strong, and let us wait and see if the opening of the market on Monday will surprise us or not.
Price Action Details in Case of Support
One point: it’s possible when the financial market opens this coming Monday morning, this specific price move we are currently seeing (Scenario 2), the one that is widely expected to trend upward, will play out this way. It is highly possible that this move will happen in this particular way over the course of the day, meaning it could come here ($5,010) and then move upward. That’s one point. The other is this downward move (Scenario 1). If it’s supposed to find support here ($4,906), it should happen like this. If this specific price move is truly supposed to find some solid support right here, it should gradually come down to exactly this point ($4,981), then go up from here ($5,016), and then down to $4,951. It should ideally move in several distinct waves just like this and then eventually begin to trend much further upward from this level. Did you get that? If it moves like this, we can expect this area ($4,906) to act as support.
Importance of Timing and Trading Sessions (London & Dubai)
If not, if it has a very steep slope, I’ll mark this with the color yellow to show that it’s less likely compared to the other scenario. Something that I really don’t expect and is very unlikely is that we move straight down ($4,832), though that’s still a possibility but it’s less likely and in that case we would move sharply downward. In my personal opinion, during the Sydney and Asian market sessions, you really shouldn’t be trading at all. You can effectively start your trades when the London market finally opens, or perhaps about an hour and a half before that London market session officially begins (10:30 AM Dubai time) to pick up speed.
Personal Entry Strategy and Liquidity Collection
If it’s going to reach this area ($4,906), I expect it to be in this zone at 10:30 AM Dubai time. That’s why, since it’s nighttime in Dubai as well and nighttime is a time for rest, I personally don’t open any trades and wait until 10:30 AM. By then, either the market is here ($5,070) or it’s made a pullback in these zones ($4,980) or in these zones ($4,900). 10:30 in the morning Dubai time is always a good time to enter the market. Exactly yesterday it was 10:30 in the morning Dubai time when I recorded the video at $4,946 and I had taken a long position here. By then it was 4:00 in the afternoon Dubai time ($4,938). Exactly around 3:30 or 4:00 in the afternoon at that time in Dubai we were in this zone and I took another long position in the market here. Timing is very important in trading. We have these three moves overall and we are watching to see where our market will be. This move (sharp downward slope) is also possible because there is liquidity here at this level which can come down to this $4,832 zone and from this area it might want to collect this liquidity and move upward. Considering that this move (from $5,078 to $4,881) was very sharp and suddenly reached 50%, it is possible that it might want to do this and move down from here ($5,037) and test the $4,832 level and then move upward.