Is a Bitcoin Crash Coming? Daily Gold & BTC Analysis – Feb 16, 2026
Gold Analysis (XAU/USD)
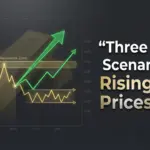
The price of gold has moved exactly according to the Corrective Scenario. Given the current zigzag structure, the hypothesis of an immediate price collapse has faded; the market is completing a corrective phase to hunt for liquidity.
- Key Support Zone: The 4905 range (confluence with the 11.8% Fibonacci level).
- Liquidity Status: Due to the Bank Holiday in the US and Canada, volatility in lower timeframes is expected to remain sideways until the necessary volume is injected in upcoming sessions.
- Outlook: Price is expected to initiate a new bullish phase after hitting the 4905 zone.
Bitcoin (BTC) Market Structure Analysis
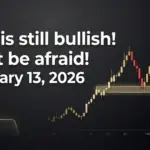
Contrary to extreme macro bearish views, Bitcoin’s current movement in long-term timeframes is still assessed as a “Technical Pullback” to the broken ceiling (Breaker Block). However, signs of weakening demand are evident in the short term.
Key Observations:
- Failure to Hold 50% Level: The price failed to stabilize above the 50% Fibonacci level, confirming buyer weakness by printing a Lower High.
- Sunday Liquidity Trap: Yesterday’s upward move was a Fake Move designed to hunt liquidity at higher levels, which was immediately met with selling pressure.
- Critical Range: The $68,000 level now acts as dynamic resistance; crossing it without heavy volume is unlikely.
Scenarios (Outlook)
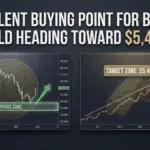
- Probable Scenario (Bearish/Neutral): Price correction to clear smart money down to the $52,000 range. This is the most attractive area for Institutional Buyers to re-enter.
- Pessimistic Scenario (Extreme Bearish): If intermediate supports are lost, a drop to $48,993 is possible, identified as the final floor of this corrective cycle.
- Long-term Target: Once this liquidity phase concludes, the “fuel” for a move toward $180,000 and $200,000 targets will be secured.
Trading Plan
Due to the formation of a lower high and lack of support at the 50% Fib level, the bias has shifted from bullish to Bearish-Neutral:
Laddered Buying: Spot accumulation in the $48,993 range with a mid-term perspective
Sell at Highs: Opening Short positions in the $69,139 range targeting lower liquidity pools.