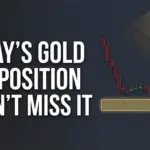
Don’t Miss It! Gold Rally Toward $5400 – Feb 18, 2026
1. Market Structure Analysis
As of February 18, 2026, Gold exhibits strong bullish momentum. The formation of five consecutive, identical candles during the Asian session confirms significant liquidity accumulation and buyer dominance.
A) Retracement Anatomy
The recent correction breached the 50% Fibonacci level, which initially appeared bearish. However, this move served as a Secondary Corrective Leg (Wave 2), designed to hunt early stop-losses and tap into deeper liquidity pools.
2. Technical Confluence
Despite previous break-even exits, the current long position is backed by high-probability technical alignments:
- Fibonacci Confluence: Price rejection from the intersection of 61.8% (minor wave) and 38.2% (major trend).
- Price Action Confirmation: A 5-minute Pin Bar followed by a Bullish Engulfing candle on the Daily timeframe.
- Breakout & Retest: Successful breach of the 1-hour local resistance, currently undergoing a healthy pullback/retest.
3. Trade Strategy & Psychology
The core shift in this analysis is the transition from Scalping to Swing Trading.
B) Risk-to-Reward (R:R) Profile
- Stop Loss (SL): $4,500
- Take Profit (TP): $60,000 (Approx. 1:13 R:R ratio)
- Current Status: Floating profit of ~$6,300, targeting the major $5,400 psychological zone.
4. Operational Tools: Risk Management EA
The trade is managed via a specialized Expert Advisor (EA) to eliminate emotional bias.
- Auto Lot Sizing: Automatically calculates volume based on a fixed risk percentage of the account balance.
- Automated Risk-Free: Moves the stop-loss to entry once the trade breathes, protecting capital from Sydney session noise.
5. Fundamental Outlook & Events
- Session Focus: Priority is given to London and New York volatility; Sydney fluctuations are treated as market noise.
- FOMC Catalyst: The upcoming FOMC Meeting Minutes (23:00 Dubai Time) is expected to be the primary driver for reaching the $5,400 target.
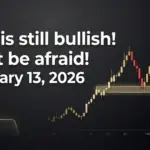
Final Bias: Strongly Bullish Target: $5,400
⚠️ Disclaimer: This report is solely a reflection of the video creator’s analysis and does not, under any circumstances, constitute definitive financial advice or a direct buy/sell signal. Trading involves significant risk.