

Candlestick
Technical Analysis
A candlestick is a chart element showing the open, high, low, and close of a period, whose body and wicks reveal the balance between buyers and sellers.
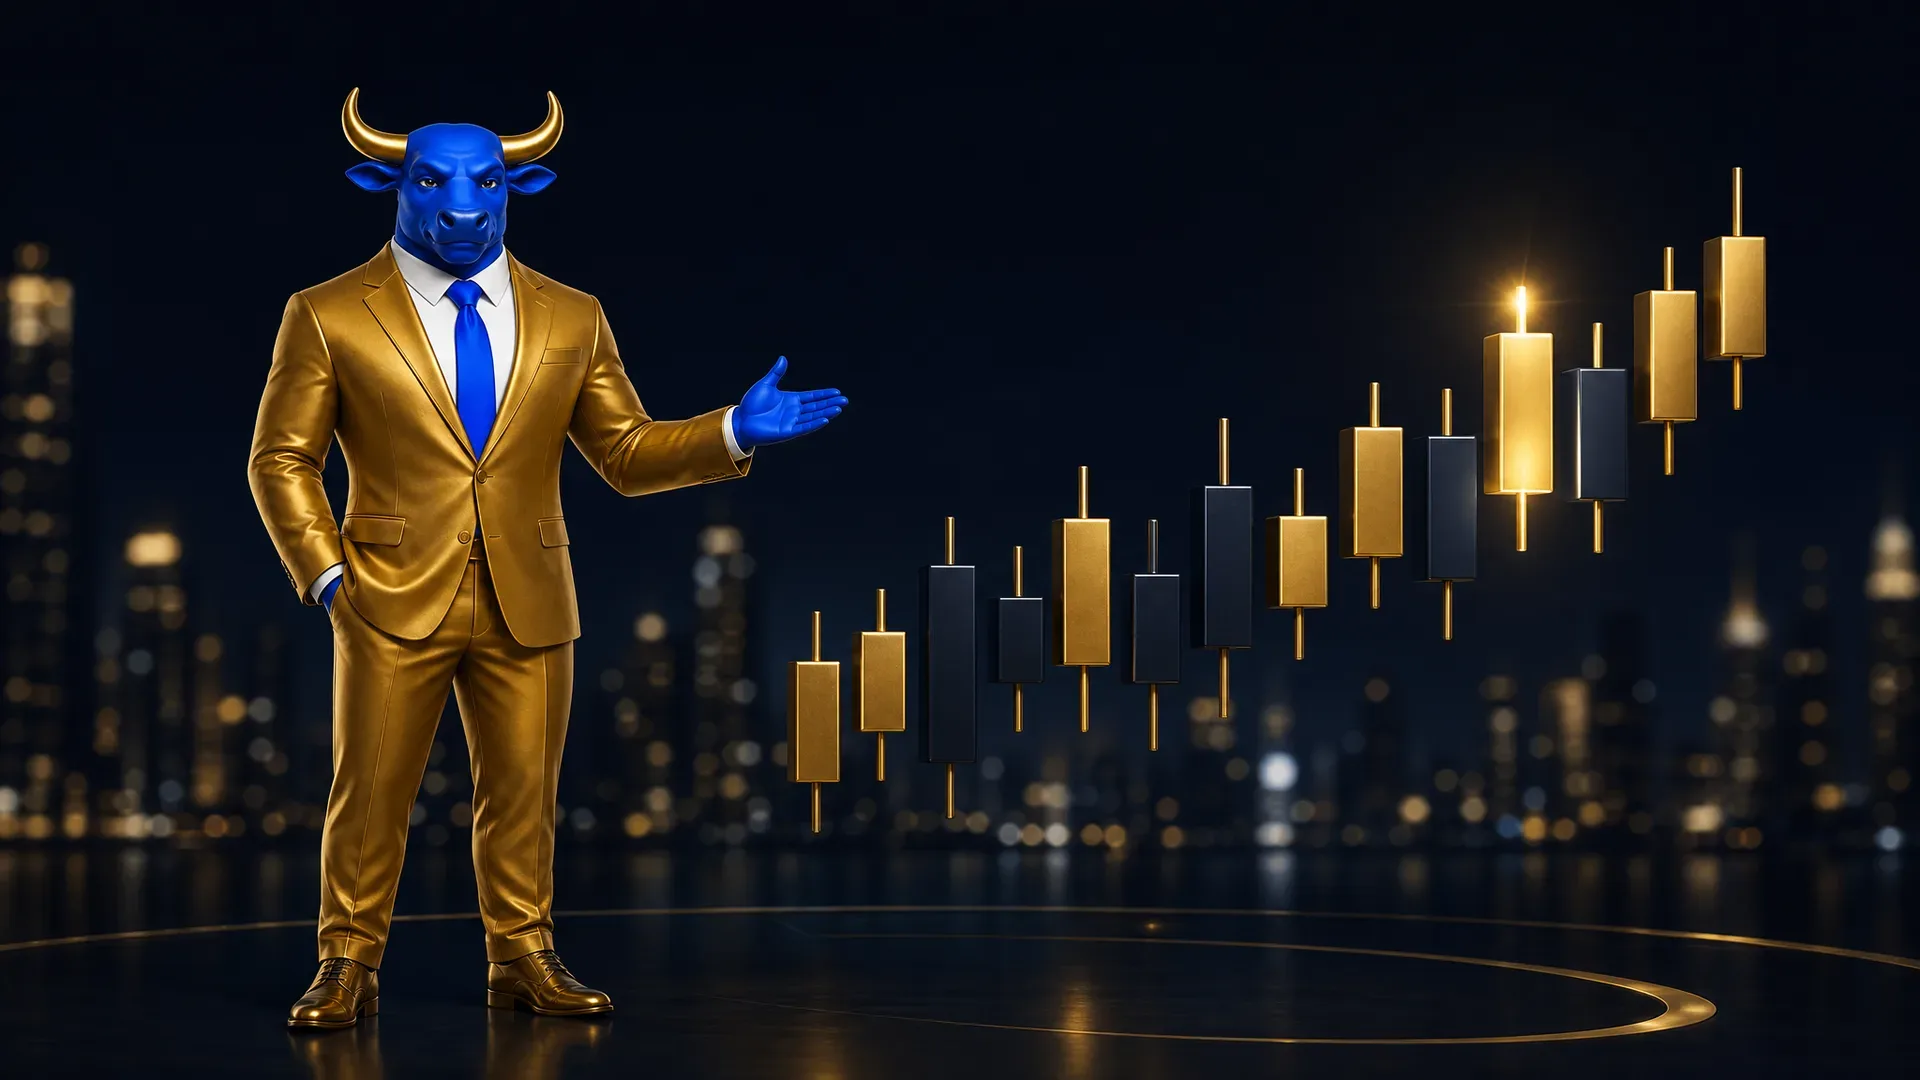
What is a candlestick?
A candlestick is the most widely used way to display price movement on a trading chart. Each candlestick summarizes four data points for a chosen time period (a minute, an hour, a day, and so on): the open, high, low, and close price — often abbreviated OHLC.
A candlestick has two main parts:
- The body — the thick rectangle between the open and close price.
- The wicks (or shadows) — the thin lines above and below the body showing the highest and lowest price reached during that period.
Reading a candlestick
If the close is higher than the open, the candlestick is typically colored green or white (a “bullish” candle). If the close is lower than the open, it is typically colored red or black (a “bearish” candle). The longer the body, the stronger the buying or selling pressure was during that period; long wicks show that price moved significantly in one direction before being pushed back.
Example
On a 1-hour EUR/USD chart, a candle that opens at 1.0850, rises to a high of 1.0880, dips to a low of 1.0845, and closes at 1.0875 would be drawn as a bullish (green) candle with a body from 1.0850 to 1.0875, a short upper wick to 1.0880, and a slightly longer lower wick to 1.0845.
Candlesticks vs. other chart types
Candlesticks pack more information into a single glance than a simple line chart (which only plots the close) or a bar chart (which uses the same OHLC data but is harder to read visually). This is why candlestick charts are the default view on almost every trading platform, including MetaTrader and TradingView.
Why it matters
Understanding individual candlesticks is the foundation for reading candlestick patterns (like a doji or engulfing candle) and for practicing price action trading more broadly, since the shape, size, and wick length of each candle reveal the real-time contest between buyers and sellers.
Related terms
See also candlestick pattern, doji, and price action.