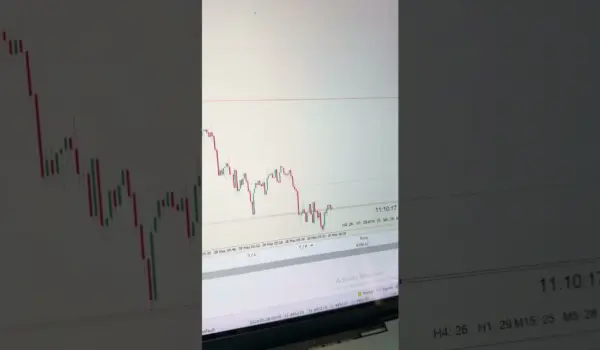
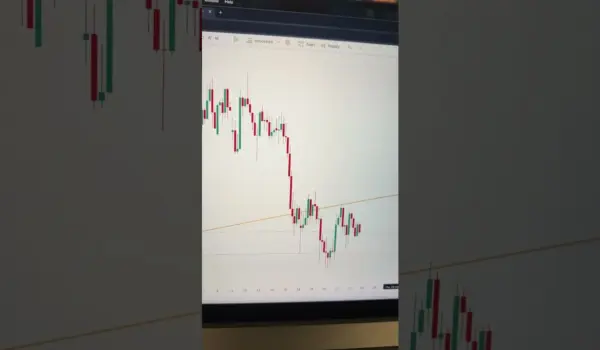
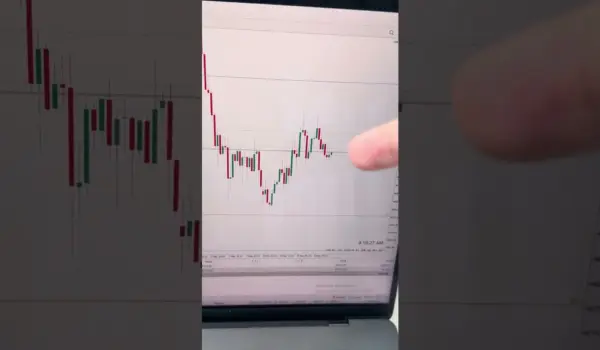
Gold Chart Analysis – April 6, 2026 – Is It Time for Gold to Drop?

Gold remains a market where trend, liquidity, and risk sentiment can shift quickly, so any discussion of a possible downside move needs to start with structure rather than prediction. When higher time frame momentum begins to slow and price starts reacting repeatedly around supply and demand zones, traders often look for signs that the market is transitioning from continuation into distribution. That transition is usually not confirmed by one candle or one session alone. It is confirmed by a sequence of lower highs, failed attempts to reclaim prior demand, and a loss of momentum at key decision areas.
For gold, the main question is whether recent price behavior is still consistent with an ongoing bullish trend or whether the market is beginning to lose balance. If buyers are still defending support and absorbing selling pressure, then pullbacks may remain corrective within a broader uptrend. If, however, price keeps stalling at resistance and liquidity above recent highs is being rejected, the probability of a deeper retracement increases. In that environment, traders often watch for breakdowns from short-term ranges, especially when those breaks occur with expanding momentum and follow-through.
Higher time frame context matters because gold can look weak on a lower chart while still holding a constructive structure on a broader one. A market can print lower highs intraday and still remain bullish if the larger trend is intact and support zones continue to attract demand. On the other hand, repeated failure to recover lost ground can be an early warning that the market is shifting from accumulation into distribution. That is why confirmation is more important than anticipation. A bearish view becomes more credible when support fails, retests are rejected, and sellers maintain control after the break.
Liquidity is another important factor in gold analysis. Price often moves toward areas where stops and resting orders are likely concentrated, then reacts sharply once those pools are taken. If gold is approaching a known liquidity area, traders should be alert to the possibility of a sweep followed by either continuation or reversal. A sweep alone does not confirm direction. What matters is how price behaves after the liquidity event. Strong rejection and recovery can support a bullish continuation scenario, while acceptance below support can open the door to further downside.
If bearish conditions develop, the most important confirmation signals are usually structural rather than emotional. Traders typically want to see lower highs, failed retests of broken support, and momentum that supports the move rather than fading it. In that case, the market may be signaling that sellers are in control and that the prior range is no longer holding. Even then, risk management remains essential because gold can reverse quickly and aggressively, especially around major technical zones.
The bullish alternative should not be ignored. If support holds and buyers step back in with strength, gold may continue its broader trend and invalidate the bearish setup. In that scenario, the market would be showing resilience rather than weakness, and any downside expectation would need to be reassessed. This is why invalidation levels matter so much in gold trading. A valid thesis should always have a clear point where it is proven wrong.
For traders, the practical takeaway is to avoid treating gold as a one-direction market. The current structure may lean bearish if momentum is fading and support is vulnerable, but the final outcome depends on confirmation. Position sizing, disciplined entries, and predefined invalidation are especially important in a volatile environment like gold. The best approach is to let price confirm the bias, then manage risk accordingly rather than trying to force a move before the market has shown its hand.